
DataMontage – Visualization of Complex Time-oriented Data
Experimentation, simulation, design, planning, and operations all require the analysis and presentation of complex, time-aligned data. Using traditional graphs, it can be hard to find important patterns in this data, so advanced visualizations for time-aligned data are required. Customization is often needed to tailor the appearance, interactivity, and integration with other displays, databases, and analytics.
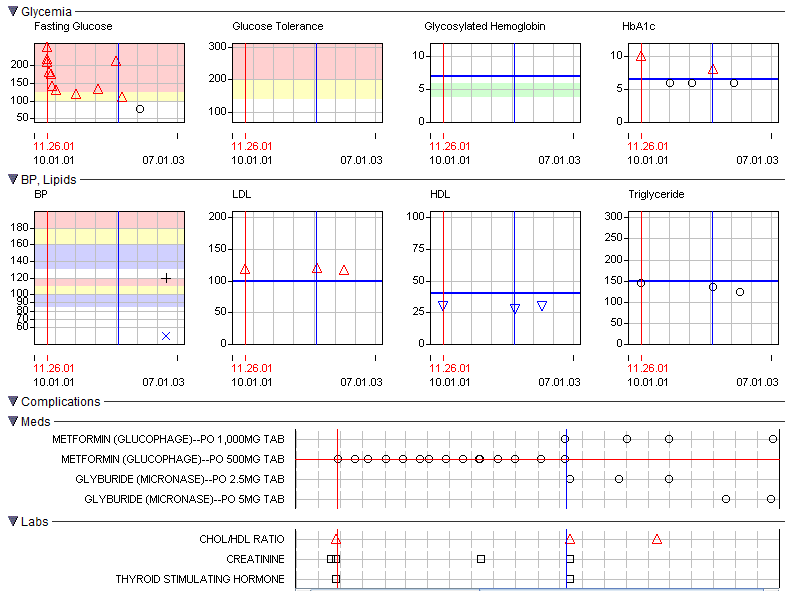
DataMontage™ software enables you to create and display arrays of timelines and graphs that share a common X or datetime axis. Graph and timeline arrays reveal relationships among numeric values, time points, and time intervals spanning many variables, individuals, and subsets. Flexible control over appearance and interactivity lets you create intuitive, information-dense data displays. A rich programming interface enables you to integrate DataMontage with other UI components, databases, and and analytics for effective analysis and decision-making.
DataMontage enables rapid and effective monitoring, review, analysis, and communication of multivariate, time-aligned data. This helps individuals and organizations understand situations and make decisions more quickly and consistently.